The Complete In-Depth Reference

Every Candlestick Pattern
Fully Explained

Psychology, anatomy, real-world examples, entry & exit rules, and common mistakes — for all 19 essential patterns.

● 8 Bullish Patterns ● 7 Bearish Patterns ● 4 Neutral Patterns
Start Learning → View Cheat Sheet
19Patterns
~35Min Read
3Categories
7Core Rules

Foundation

Before You Read Any Pattern

Every pattern is built on four numbers. Understand these and the rest becomes obvious.

The Four Price Points

O
OpenThe price at the very start of the session. This is where trading begins.
C
CloseThe price at the end of the session. This is the final verdict of the battle.
H
HighThe highest price reached. Shown as the tip of the top wick.
L
LowThe lowest price reached. Shown as the tip of the bottom wick.

The Golden Rules

1.Green/White candle = Close > Open. Buyers won the session.
2.Red/Black candle = Close < Open. Sellers won the session.
3.The body = distance between Open and Close.
4.The wicks/shadows = how far price explored beyond the body.
5.Context matters more than the candle itself. Where in the trend does it appear?
6.Always wait for the next candle to confirm before acting on a signal.

Quick Reference

Complete Cheat Sheet

All 19 patterns at a glance. Bookmark this table for quick reference during analysis.

# Pattern Candles Direction Forms At Reliability Confirmation Needed?
01Doji1NeutralAny trendMediumAlways — wait for next candle
02Hammer1BullishBottom of downtrendHighYes — next candle above high
03Inverted Hammer1BullishBottom of downtrendMediumEssential — requires strong bullish confirmation
04Hanging Man1BearishTop of uptrendMediumYes — next candle below close
05Shooting Star1BearishTop of uptrendHighYes — next candle below low
06Spinning Top1NeutralAny trendLowAlways — breakout above/below wicks
07Marubozu1BullBreakouts, trend movesHighNot always — strong on its own
08Pin Bar1Bull/Key S/R levelsHighOptional but improves reliability
09Bullish Engulfing2BullishBottom of downtrendHighPattern is own confirmation
10Bearish Engulfing2BearishTop of uptrendHighPattern is own confirmation
11Piercing Line2BullishBottom of downtrendMediumYes — third candle confirms
12Dark Cloud Cover2BearishTop of uptrendMediumYes — third candle confirms
13Harami2NeutralAny trendMediumAlways — wait for Day 3
14Inside Bar2BothAny — after strong moveMediumYes — trade the breakout only
15Outside Bar2BothAny — key levelsHighDepends on closing direction
16Morning Star3BullishBottom of downtrendVery HighDay 3 is the confirmation
17Evening Star3BearishTop of uptrendVery HighDay 3 is the confirmation
18Three White Soldiers3BullishBottom of downtrendVery HighDay 3 close = full confirmation
19Three Black Crows3BearishTop of uptrendVery HighDay 3 close = full confirmation

1-Candle Patterns

Single-Candle Patterns

One candle — one story. These patterns speak volumes about what happened in a single session and hint at what comes next.

01
⬡ Neutral · Indecision
Doji
Also known as: Cross Candle

"The market is paralyzed. Nobody won. A big decision is coming — and soon."

Doji candlestick pattern — four types: standard, dragonfly, gravestone, and long-legged doji showing complete market indecision
4 Doji Variants
What Is It & Why It Forms

A Doji forms when a session's opening and closing prices are virtually identical, leaving a cross-shaped candle. The wicks can be long or short — what matters is the flat (or near-flat) body.

It forms because buyers and sellers fought to a complete standstill. Buyers pushed prices up during the session. Sellers pushed them back down. Neither side could claim victory. When the dust settled, the price was almost exactly where it started.

This is the market saying: "We are at a crossroads. We don't know which way to go." The Doji doesn't predict the direction — it predicts that a direction is coming.

Real-World Analogy

Imagine two equally-matched armies charging at each other. Both fight fiercely. But at the end of the day, the battle line hasn't moved. That frozen battle line is the Doji body — exhaustion on both sides, with a major breakthrough expected soon.

The 4 Types of Doji
Standard DojiEqual upper and lower wicks. Pure indecision. Found in the middle of trends as a warning sign.
Dragonfly DojiLong lower wick, no upper wick. Sellers crashed the price way down, but buyers fought all the way back up to the open. Bullish bias at the bottom of a downtrend.
Gravestone DojiLong upper wick, no lower wick. Buyers drove the price way up, but sellers crushed it all the way back. Bearish bias at the top of an uptrend.
Long-Legged DojiVery long wicks on both sides. Extreme volatility with zero resolution. Signals massive uncertainty — the biggest move is yet to come.
⚡ How to Trade It

Never trade the Doji alone. It's a warning, not a signal. After a Doji, wait for the very next candle. If it breaks above the Doji's high → potential buy. If it breaks below the Doji's low → potential sell. Volume should confirm the breakout direction.

Common Mistakes
  • Trading the Doji before the next candle confirms direction.
  • Ignoring context — a Doji in the middle of a strong trend is meaningless noise.
  • Treating all Dojis the same. A Dragonfly and a Gravestone have opposite biases.
  • Forgetting that a tiny body isn't always a Doji — "near Doji" candles with small bodies also signal indecision.
Key Stats & Context
Candles:1
Signal:Neutral
Reliability:Medium
Timeframe:Any
Best Context for Doji

Most powerful when it appears after a long trending move (up or down). A Doji after 5+ bullish candles suggests buyers are exhausted. A Doji after a long decline suggests sellers are running out of steam. At key support/resistance levels, the Doji becomes significantly more reliable.

02
▲ Bullish Reversal
Hammer
Also known as: Hanging Man (same shape, top of uptrend)

"Sellers tried to destroy this stock. Buyers said no — and fought all the way back."

Hammer candlestick pattern — bullish reversal signal with long lower wick showing buyer strength at the bottom of a downtrend
Green & Red versions
The Full Story Behind the Hammer

The Hammer is one of the most recognizable and trusted patterns in all of technical analysis. It forms at the bottom of a downtrend and looks exactly like a hammer — small head at the top, long handle below.

Here's what happened during this session: The session opened, and sellers immediately took control. They drove the price way down — sometimes 2×, 3×, or more below the opening price. It looked like another catastrophic day.

Then something changed. Buyers stepped in aggressively. They pushed back against the selling — hard. They fought all the way back up, recovering almost all of the ground the sellers had taken. By the close, the price was back near the open.

The long lower wick is the visual proof of that buyer comeback. The bigger the wick relative to the body, the more powerful the signal.

Anatomy & Rules
Lower WickMust be at least 2× the body's height. The longer the better — it shows the scale of the buyer comeback.
BodySmall body at the top of the candle's range. Green (bull) is stronger than red, but both are valid.
Upper WickLittle or no upper wick. Any significant upper wick weakens the signal.
LocationMust appear after a defined downtrend. A Hammer in the middle of a range or uptrend means nothing.
▲ How to Trade It

Entry: Buy when the next candle closes above the Hammer's high — this confirms buyers have taken control.
Stop-Loss: Just below the Hammer's low (the tip of the bottom wick).
Confirmation booster: High volume on the Hammer day + bullish next candle = very strong setup.

Common Mistakes
  • Buying the Hammer candle itself — always wait for the next candle to confirm.
  • Ignoring the trend context. A hammer shape at the top of a rally is a Hanging Man (bearish warning), not a bullish signal.
  • Accepting hammers with upper wicks as long as the lower wick. The imbalance is key.
  • Not setting a stop-loss below the wick — if the low breaks, the pattern has failed.
Why Green Is Stronger Than Red

A green Hammer means buyers not only fought back — they actually finished the day ahead of where they started (close > open). That's extra confirmation of bullish conviction.

A red Hammer still means buyers fought back strongly (the long wick proves this), but they couldn't quite recover to the open. It's still a valid signal, just slightly weaker. Always look for additional confirmation.

Candles:1
Trend:Bottom of Downtrend
Reliability:High
Stop:Below Low
03
▲ Bullish Reversal
Inverted Hammer
Also known as: Shooting Star (same shape, top of uptrend)

"Buyers made a powerful push upward. They couldn't hold it — but they're waking up. A reversal is brewing."

Inverted Hammer candlestick pattern — bullish reversal at bottom of downtrend with long upper wick showing initial buyer effort
At bottom of downtrend
What Happened During This Session

The Inverted Hammer is an upside-down hammer that appears at the bottom of a downtrend. It looks alarming at first — there's a big wick shooting upward from a tiny body at the bottom. That seems bearish, right? Wrong.

Here's the psychology: The market opened low (after a downtrend). Buyers then pushed aggressively upward — driving the price significantly higher during the session (that's the long upper wick). But sellers came back and pushed it back down by the close.

The key insight: For the first time in the downtrend, buyers showed real strength. They didn't win the session — but they put up a serious fight that they hadn't shown before. This is a warning to sellers: the bears may be losing their grip.

Because buyers couldn't fully hold the recovery, this pattern requires stronger confirmation than a regular Hammer before trading it.

Anatomy & Comparison to Shooting Star
Upper WickMust be at least 2× the body's height. This is the "attempted" bullish push.
BodySmall body at the bottom of the candle's range. Color matters less here.
Lower WickLittle or no lower wick. The session low ≈ the body's low.

Critical context rule: The exact same candle shape appearing at the top of an uptrend is called a Shooting Star — and it's bearish. The candle is identical; only the location changes its meaning entirely.

▲ How to Trade It

This pattern needs confirmation more than almost any other. Only enter long if the next candle is a clear bullish (green) candle that closes above the Inverted Hammer's high. Stop-loss below the pattern's low.

Common Mistakes
  • Treating it as equally strong as a regular Hammer — it requires more confirmation.
  • Confusing it with a Shooting Star (same shape, opposite context and meaning).
  • Entering on the Inverted Hammer candle itself without waiting for the next candle to confirm.
Pattern Stats
Candles:1
Trend:Bottom of Downtrend
Reliability:Medium
Inverted Hammer vs Shooting Star — Side by Side

Same candle shape. What changes everything is location.
Inverted Hammer = bottom of downtrend → buyers waking up → bullish
Shooting Star = top of uptrend → buyers rejected → bearish

This is why candlestick analysis always begins with asking: "Where in the trend am I looking?"

04
▼ Bearish Reversal
Hanging Man
Also known as: Bearish Hammer (same shape as Hammer, opposite context)

"The rally looks healthy — but sellers just tried to destroy it from within. The asset is losing support."

Hanging Man candlestick pattern — bearish reversal warning at top of uptrend, same shape as hammer but opposite context
At top of uptrend
Why the Same Shape Means Something Different

The Hanging Man is visually identical to a Hammer — small body at the top, long lower wick. But it appears at the top of an uptrend, and that changes everything.

During this session, the stock was in a healthy uptrend. The session opened, and then something unexpected happened: sellers violently crashed the price deep below the open. The long lower wick shows how far down sellers drove prices.

Yes, buyers recovered by the close. But the key psychological message is: sellers are now powerful enough to crash this stock significantly during the session. That's new. That didn't happen during the uptrend. It means the support that drove prices higher is starting to crack.

The name is grim for a reason — the long wick "hangs" below the body like legs dangling, suggesting the stock's uptrend may soon be "hanging" in trouble.

Anatomy & Key Rules
Lower WickAt least 2× the body's height. The longer, the more dangerous — it shows how far sellers pushed prices.
Upper WickLittle or none. If there's a significant upper wick, the pattern is weakened.
Body ColorA red body is more bearish than green — sellers finished the session lower than the open. Green still warns but less forcefully.
VolumeHigh volume on a Hanging Man is a serious warning. It means a lot of sellers participated in the crash-and-recover. The next session becomes critical.
▼ How to Trade It

Don't sell immediately. Wait for the next candle to close below the Hanging Man's close. That confirmation is your sell/short entry signal. Stop-loss above the Hanging Man's high (top of body or top wick).

Common Mistakes
  • Treating it as bullish because it looks like a Hammer. Location determines meaning.
  • Selling immediately on the Hanging Man. Always wait for the bearish confirmation candle next session.
  • Ignoring it when volume is high. High volume Hanging Man = treat as urgent warning.
  • Using it in a downtrend — a Hanging Man only matters at the top of an uptrend.
Pattern Stats
Candles:1
Trend:Top of Uptrend
Reliability:Medium
Confirmation Required

The Hanging Man alone is a warning, not a sell signal. The actual sell signal is the next bearish candle. If the next session instead closes higher than the Hanging Man's high — the pattern is nullified and the uptrend continues. Never jump the gun.

05
▼ Bearish Reversal
Shooting Star
Bearish twin of the Inverted Hammer

"Buyers blasted off like a rocket — then sellers dragged them all the way back to Earth. The rally is over."

Shooting Star candlestick pattern — bearish reversal at top of uptrend showing complete buyer rejection with long upper wick
At top of uptrend
The Full Session Story

The Shooting Star is one of the most powerful single-candle bearish signals. It appears at the top of an uptrend and tells a devastating story for bulls.

The session begins and buyers are in full control. They push prices aggressively higher — sometimes dramatically so. The stock is rocketing. It looks like another great bullish session.

Then something breaks. Sellers flood the market. They overwhelm the buyers completely and drive prices all the way back down — erasing nearly all of the day's gains. By the close, the price is near the session's opening level (or even lower).

That massive upper wick is the proof: buyers tried their hardest and were completely rejected at higher prices. This is a sign that the market has found a ceiling — a resistance level — that it cannot break through. The bears are in control now.

Anatomy & Strict Rules
Upper WickMust be at least 2× the body's height. Longer is more bearish. This is the "failed rocket launch."
BodySmall, positioned at the bottom of the candle's range. Red body = stronger signal; Green body = still valid but weaker.
Lower WickMust be very small or nonexistent. The close should be near or at the session low.
Gap UpA Shooting Star that gaps up from the previous session is even more bearish — the rejection is even more dramatic.
▼ How to Trade It

Entry: Sell/short when the next session's candle closes below the Shooting Star's low.
Stop-Loss: Above the top of the Shooting Star's upper wick.
Power confirmation: High volume on the Shooting Star + bearish gap or confirmation candle = very high conviction sell.

Common Mistakes
  • Shorting immediately on the Shooting Star candle without waiting for confirmation.
  • Ignoring the body color — a red body (close below open) is significantly more bearish than green.
  • Missing it in context — a Shooting Star only works at the TOP of an uptrend.
  • Confusing with an Inverted Hammer. Same shape, opposite location, opposite meaning.
Pattern Stats
Candles:1
Trend:Top of Uptrend
Reliability:High
Stop:Above High
06
⬡ Neutral · Trend Exhaustion
Spinning Top
Also known as: Small-Body Candle, Indecision Candle

"Both sides fought hard and achieved nothing. The market is at a crossroads — the current trend is running on fumes."

Spinning Top candlestick pattern — neutral indecision candle with equal upper and lower wicks signaling trend exhaustion
Color doesn't matter
How a Spinning Top Differs from a Doji

A Spinning Top is similar to a Doji but has a visible small body rather than a flat cross. The body exists — meaning one side did edge out a small win — but it's tiny relative to the wicks.

The key characteristics: roughly equal upper and lower wicks that are substantially longer than the body, and a small real body that can be either green or red. The color barely matters here because the body is so small that the directional difference is insignificant.

The session saw buyers push prices up (upper wick) and sellers push prices down (lower wick) — and both sides retreated to near where they started. It's a tug-of-war that went nowhere.

Unlike the Doji which signals complete indecision, the Spinning Top suggests the current trend is losing momentum — one side is beginning to tire, but we don't yet know which direction the market will break.

When It Becomes Significant
!
After a Long UptrendSpinning Top signals that bulls are losing confidence. The pattern alone doesn't reverse the trend — but it's a clear warning to tighten stops on long positions.
!
After a Long DowntrendSpinning Top signals that sellers are exhausted. Watch for a bullish reversal — but wait for confirmation before buying.
!
At Key LevelsA Spinning Top at support or resistance is more significant than one mid-trend. The battle at these levels is especially meaningful.
⚡ How to Trade It

The Spinning Top itself is not an entry signal — it's a pause signal. Stop adding to positions in the current trend direction. Wait for the next candle:
• If it breaks above the Spinning Top's high → trend likely continues upward.
• If it breaks below the Spinning Top's low → potential reversal downward.

Common Mistakes
  • Treating Spinning Tops in the middle of a strong trend as meaningful — they're often just noise.
  • Entering trades based on a Spinning Top alone without confirmation from the next candle.
  • Ignoring the location — context inside a trend vs. at a key reversal level are very different situations.
Pattern Stats
Candles:1
Signal:Neutral
Reliability:Low–Medium
07
▲▼ Trend Continuation / Momentum
Marubozu
Japanese: "close-cropped" or "shaved head/bottom"

"One side owned every single tick of this session. No hesitation. No pullback. Pure, uncontested dominance."

Marubozu candlestick pattern — maximum momentum candle with zero wicks showing one-sided session control
Zero wicks
The Most Decisive Candle There Is

The Marubozu is the purest expression of momentum in candlestick analysis. Its defining feature is simple: no wicks on either end.

This means the session opened at the absolute low (bull) or absolute high (bear) — and moved in one direction without ever looking back. There was no intraday pullback significant enough to leave a wick. The winning side had total control from the opening bell to the closing bell.

A Bullish (Green) Marubozu: Open = Low, Close = High. Buyers took control from the very first trade and never once let sellers make a move. The price climbed relentlessly all session.

A Bearish (Red) Marubozu: Open = High, Close = Low. Sellers took over immediately and crushed the price all session without giving buyers a moment's relief.

This isn't just a reversal signal — it's often a trend continuation signal. When you see a Marubozu after a breakout, it tells you the move is real and has strong conviction behind it.

Three Varieties of Marubozu
Full MarubozuZero wicks on either end. The purest form. Extremely rare and extremely powerful. One side controlled 100% of the session.
Open MarubozuNo wick on the opening end, small wick on the closing end. Still very strong — the opening was decisive, with only minor resistance near the close.
Close MarubozuSmall wick on the opening end, no wick on the closing end. The session started with some opposition but ended with total dominance.
▲ How to Trade a Bullish Marubozu

Breakout confirmation: A Bullish Marubozu after breaking a key resistance level confirms the breakout is real. Enter long on the next session's open or a slight pullback. Stop below the Marubozu's low.

▼ How to Trade a Bearish Marubozu

Breakdown confirmation: A Bearish Marubozu after breaking a key support confirms the breakdown. Enter short. Stop above the Marubozu's high.

Common Mistakes
  • Chasing a Marubozu by entering too far away from it — the best entries come on small pullbacks to the candle's midpoint or open.
  • Ignoring that a Marubozu can signal a trend continuation AND a reversal depending on context.
  • Expecting Marubozus to be common — pure full Marubozus are rare. Most are "open" or "close" variants.
Pattern Stats
Candles:1
Signal:Strong Momentum
Reliability:High
Marubozu After Earnings

Earnings announcements frequently produce Marubozu candles — especially after big beats or misses. A large-bodied, wick-free candle on earnings day is one of the clearest signals that institutional money has decisively repositioned, making continuation very likely over the next few sessions.

08
▲▼ Powerful Reversal
Pin Bar
Also known as: Pinocchio Bar — the market told a lie and snapped back

"The price tried to break out in one direction, got caught in a lie, and snapped violently back the other way. A powerful rejection."

Pin Bar candlestick pattern — powerful rejection candle with long nose wick showing stop hunt and sharp price reversal
Bullish & Bearish versions
The "Pinocchio" Concept Explained

The Pin Bar gets its nickname because the market "lies." The long wick — called the "nose" (like Pinocchio's) — shoots out in one direction, trapping traders who follow the fake move. Then the market snaps back violently the other way, trapping and punishing those who followed the false breakout.

Bullish Pin Bar: The nose points downward. Sellers drove price down aggressively, triggering stop-losses below support. Then buyers overwhelmed them completely, driving the price back up. All those sellers got trapped. Buyers now have control.

Bearish Pin Bar: The nose points upward. Buyers drove price up aggressively, triggering buy orders above resistance. Then sellers overwhelmed them, driving the price back down. All those buyers got trapped.

The Pin Bar is especially powerful because it catches trapped traders on the wrong side — their forced exits (stop-loss triggers) fuel the reversal even further.

Strict Anatomy Rules
The Nose (Long Wick)Must be at least ⅔ of the total candle length (from the body tip to the nose tip). The bigger the nose, the more powerful the rejection.
The BodyTiny, positioned at the opposite end from the nose. Where the body sits tells you the direction: body at top = bullish (down-wick nose), body at bottom = bearish.
Opposite-End WickThe short wick on the opposite side from the nose should be very small or absent — the close should be near the candle's opposite extreme.
Best LocationAt key support or resistance levels, trend lines, Fibonacci levels, or moving averages. A Pin Bar in the middle of nowhere is much weaker.
▲ Trading a Bullish Pin Bar

Entry: Buy on the open of the next candle, or on a 50% retracement of the Pin Bar body (conservative). Stop-loss just below the bottom of the nose. Target: nearest resistance or 2:1 risk/reward.

Common Mistakes
  • Trading Pin Bars not at key levels — a Pin Bar needs a "story" (support, resistance, trend line) to be credible.
  • Accepting wicks that are too short — the nose must dominate the candle. Small wicks aren't Pin Bars.
  • Trading against the higher-timeframe trend — Pin Bars with the trend are far more reliable than counter-trend ones.
Pattern Stats
Candles:1
Location:Key S/R Levels
Reliability:High
The "Stop Hunt" Connection

Many Pin Bars form because large institutional players deliberately push price to known stop-loss clusters (just below support or above resistance) to trigger them, accumulate inventory at better prices, then reverse. The Pin Bar's nose is literally the footprint of this "stop hunt." Recognizing this gives you a powerful edge in understanding why they work so consistently.

2-Candle Patterns

Two-Candle Patterns

Two candles build a richer story — the first sets up the situation, and the second delivers the verdict. Together, they carry more conviction than any single candle alone.

09
▲ Powerful Bullish Reversal
Bullish Engulfing

"Buyers didn't just win — they completely obliterated the sellers and kept going. A total shift in power."

Bullish Engulfing two-candle pattern — large green candle completely engulfs prior red candle showing total buyer takeover
Day 1: Bear · Day 2: Bull
The Two-Day Story

Day 1: A bearish (red) candle — sellers are in control and the downtrend continues as expected.

Day 2: Something dramatic happens. The session opens lower than the previous close — gapping down, which initially seems even more bearish. But then buyers immediately launch a powerful counterattack. They drive the price higher all session — not just recovering the previous day's losses, but surging well past the previous day's open.

The result: a large green candle whose body completely covers (engulfs) the previous red candle's body. The bulls have done two things: reversed the prior day's move AND added new gains on top. This is a total shift in market control.

The pattern is even more powerful when the green candle engulfs not just the body but also the wicks of the prior red candle — showing complete dominance.

Anatomy & Power Rules
Day 1A bearish (red) candle. Can be any size, but a smaller body makes the engulfing more dramatic on Day 2.
Day 2 OpenOpens below Day 1's close (gap down). This gap makes the reversal even more striking because bulls overcame an initially worse situation.
Day 2 CloseCloses above Day 1's open — the green body fully covers the red body. The bigger the green candle, the more powerful.
VolumeHigh volume on Day 2 dramatically increases reliability. It means institutions are participating in the reversal.
▲ How to Trade It

Entry: Buy on the open of Day 3, or as Day 2 closes above Day 1's open (aggressive entry).
Stop-Loss: Below the low of the Bullish Engulfing pattern (Day 2's low).
Best conditions: At major support + high volume + the green candle is significantly larger than the red.

Common Mistakes
  • Accepting a pattern where the green candle only partially covers the red — it must fully engulf the body.
  • Trading it without a clear prior downtrend — a Bullish Engulfing in a sideways market has far less meaning.
  • Ignoring the size relationship — a massive red candle engulfed by a barely-larger green candle is weak. The green should be noticeably larger.
Pattern Stats
Candles:2
Trend:Bottom of Downtrend
Reliability:High
10
▼ Powerful Bearish Reversal
Bearish Engulfing

"Sellers swept in and completely overwhelmed the buyers — erasing all of their gains and going further. The bulls have been routed."

Bearish Engulfing two-candle pattern — large red candle completely engulfs prior green candle showing seller domination
Day 1: Bull · Day 2: Bear
The Two-Day Story

Day 1: A bullish (green) candle — buyers are in control and the uptrend seems to continue.

Day 2: The session gaps up (seeming to promise more upside), but sellers immediately hammer the price. They don't just reverse the previous day's gains — they crash through the previous day's open entirely, closing below it with a large red candle that completely engulfs the prior green body.

This is a total market reversal. The same buyers who were celebrating yesterday are now trapped, watching their profits evaporate. Those trapped longs become fuel for the selling pressure as they exit with stop-losses.

The bigger the red candle relative to the green one, the more powerful the signal.

Anatomy & Power Amplifiers
Day 1Bullish green candle. A smaller prior green body makes the engulfing more dramatic.
Gap Up on Day 2The session opens above Day 1's close. The subsequent crash past Day 1's open is even more devastating after the fake gap-up optimism.
Day 2 CloseMust close below Day 1's open — the red body must fully cover the green body.
▼ How to Trade It

Entry: Sell/short on the open of Day 3, or as Day 2's close moves below Day 1's open.
Stop-Loss: Above the high of the pattern (Day 2's high).
Best conditions: At major resistance + high volume + after a prolonged uptrend.

Common Mistakes
  • Partial engulfing — the red candle must fully cover the green body, not just overlap it.
  • Using it mid-trend or in sideways markets where there's no clear uptrend to reverse.
  • Ignoring that this is most powerful at tested resistance levels, not random chart locations.
Pattern Stats
Candles:2
Trend:Top of Uptrend
Reliability:High
11
▲ Bullish Reversal
Piercing Line

"The selloff looked overwhelming. Then buyers pierced through the halfway mark — showing they have the power to recover."

Piercing Line two-candle bullish reversal pattern — green candle closes above 50% midpoint of prior red candle
Green closes above 50%
The 50% Rule — Why It Matters

Day 1: A long bearish (red) candle. Sellers are winning convincingly.

Day 2: The session gaps down below Day 1's close — which initially looks even more bearish. But buyers immediately mount a comeback. They drive the price steadily upward all session long, ultimately closing above the 50% midpoint of Day 1's red candle.

The 50% threshold is critical. Crossing it means buyers have recovered more than half of the previous day's selling losses in a single session. That's a dramatic demonstration of bullish buying power.

Think of it like a sports comeback: if your team was down 6-0 and fights back to lead 4-3 by halftime, you'd feel very differently about the second half. The buyers just made that kind of comeback.

Difference from Bullish Engulfing

The Piercing Line is similar to a Bullish Engulfing but doesn't complete the full reversal. In an Engulfing, Day 2 closes above Day 1's open — a full reversal. In a Piercing Line, Day 2 closes above Day 1's midpoint but below Day 1's open. It's a bullish reversal signal, but slightly weaker and requires more careful confirmation.

Anatomy
Day 2 Opens BelowMust open below Day 1's close. The gap down sets up the "pierce" by showing buyers overcame even a worse starting point.
Day 2 Closes Above 50%The close must exceed the midpoint of Day 1's body. Closing exactly at 50% is not enough — it must pierce through it.
Both Candles Long-BodiedBoth Day 1 and Day 2 should have substantial bodies. A Piercing Line with short candles carries little conviction.
▲ How to Trade It

Enter long after Day 2 confirms (on Day 3's open). Stop below Day 2's low. The closer the close is to Day 1's open (the higher the pierce), the stronger the signal.

Common Mistakes
  • Treating a 49% recovery as a Piercing Line — the 50% rule is strict.
  • Confusing it with a Bullish Engulfing (which requires closing above Day 1's open).
  • Using it without confirming that a prior downtrend exists — context is essential.
Pattern Stats
Candles:2
Trend:Bottom of Downtrend
Reliability:Medium
12
▼ Bearish Reversal
Dark Cloud Cover

"The rally looked bright — then a dark cloud rolled in and wiped out more than half the gains. The bull run is clouding over."

Dark Cloud Cover two-candle bearish reversal pattern — red candle closes below 50% midpoint of prior green candle
Red closes below 50%
The Bearish Mirror of Piercing Line

Day 1: A strong bullish (green) candle. The uptrend is healthy.

Day 2: The session gaps up above Day 1's close — optimism is high. But sellers immediately take control and drive the price down relentlessly. By the close, the price has crashed below the 50% midpoint of Day 1's green candle.

That 50% penetration is the critical signal. Sellers have erased more than half of the previous session's bullish gains — in a single session. This is a significant demonstration of selling power that the bulls did not expect.

The pattern is called "Dark Cloud Cover" because, like a storm rolling in on a sunny day, the big red candle casts a shadow over the bullish sentiment that had been building.

Anatomy
Day 2 Opens AboveMust open above Day 1's close (gap up). The initial fake bullish optimism makes the reversal more dramatic.
Day 2 Closes Below 50%Must close below the midpoint of Day 1's green body. The further below 50%, the more bearish.
Both Candles SubstantialBoth candles should have long bodies for the pattern to carry weight.
▼ How to Trade It

Sell/short on Day 3's open, or as Day 2 closes below Day 1's midpoint. Stop-loss above Day 2's high (the gap-up open). If Day 2's red candle closes very close to Day 1's open (near full engulf), treat it as near-Bearish Engulfing strength.

Common Mistakes
  • Accepting a close that barely crosses 50% — the deeper the penetration, the more reliable the signal.
  • Mixing up Dark Cloud Cover and Bearish Engulfing — Dark Cloud doesn't fully engulf, making it slightly weaker.
  • Ignoring the uptrend context — this must appear at the top of an uptrend.
Pattern Stats
Candles:2
Trend:Top of Uptrend
Reliability:Medium
13
⬡ Trend Pause / Reversal Warning
Harami
Japanese: "Pregnant" — the small candle is the "baby" inside the large candle

"Momentum has hit a sudden wall. The market has gone quiet — but a direction change is almost certainly brewing."

Harami two-candle pattern — small candle body contained within large prior candle body signaling trend pause and potential reversal
Bearish & Bullish Harami
Why "Pregnant" Is the Perfect Description

Day 1: A large, strong candle in the direction of the existing trend. Everything looks normal.

Day 2: A tiny candle appears — its entire body fits within the body of Day 1. Not just smaller — completely contained inside the previous candle, like a baby in a womb.

What happened? The market had a sudden, complete loss of momentum. The session opened within yesterday's range, moved barely at all, and closed still within yesterday's range. The conviction that drove the prior trend has evaporated overnight.

A Bearish Harami has a large green Day 1 candle followed by a small red Day 2 candle tucked inside — after an uptrend. It warns that buyers may be running out of steam.

A Bullish Harami has a large red Day 1 candle followed by a small green Day 2 candle tucked inside — after a downtrend. It warns that sellers may be exhausting themselves.

Harami vs Inside Bar — Key Difference

These look similar but have an important distinction:

H
HaramiThe small candle's body only must fit inside the large candle's body. Wicks can extend outside.
I
Inside BarThe small candle's entire range (high to low, including wicks) must fit inside the prior candle's range. Stricter rule.
⚡ How to Trade It

The Harami is a warning, not a trigger. On Day 2, tighten stop-losses on existing trend positions. Wait for Day 3 to confirm:
• Bullish Harami: Day 3 closes above Day 2's high → consider buying
• Bearish Harami: Day 3 closes below Day 2's low → consider selling

Common Mistakes
  • Acting on the Harami alone — it's a warning, not a confirmed reversal signal without Day 3.
  • Confusing Harami (body-within-body) with Inside Bar (full range within full range).
  • Ignoring Harami Cross — when Day 2 is a Doji inside Day 1, this is an even stronger pause signal.
Pattern Stats
Candles:2
Signal:Trend Pause
Reliability:Medium
14
⬡ Continuation or Reversal
Inside Bar
Also known as: Mother Bar + Inside Bar setup

"The market is coiling up like a spring. Volatility has collapsed — a big explosive move in either direction is loading up."

Inside Bar two-candle volatility contraction pattern — entire second candle range fits within mother bar signaling coiled breakout
Inside bar fits within mother
The Spring Loading Concept

The Inside Bar is a pattern of volatility contraction — a pause in the market's breathing. The "mother bar" is a relatively large candle that represents a normal active session. The "inside bar" that follows is a much smaller candle whose entire range — including wicks — fits within the mother bar's high-to-low range.

What does this mean? The entire session didn't even reach yesterday's high or low. Price action compressed dramatically. Buyers and sellers are in a standoff — neither side could push beyond the previous session's boundaries.

This is like a spring being compressed. The longer the price stays compressed, the more energy builds for the eventual breakout. Traders don't predict direction — they wait for the spring to release.

Inside Bars are especially common just before major market-moving events (earnings, economic data) or after a significant trending move that needs to "digest."

Breakout Trading Strategy
Bullish BreakoutPrice closes above the mother bar's high → strong buy signal. The bulls broke the compression zone.
Bearish BreakoutPrice closes below the mother bar's low → strong sell signal. The bears broke through the compression floor.
Failed BreakoutPrice briefly breaks out but immediately reverses back inside → potential trap. Exit the position and reassess.
⚡ The Bracket Order Strategy

Many traders place two breakout orders simultaneously:
• A buy-stop just above the mother bar's high
• A sell-stop just below the mother bar's low
Whichever triggers first is the trade. Cancel the other immediately. Stop-loss on the triggered order goes just on the other side of the mother bar.

Common Mistakes
  • Confusing it with Harami (which only requires body containment, not full wick containment).
  • Trading the breakout without context — inside bars at key support/resistance are far more powerful than random mid-trend ones.
  • Holding a failed breakout — if price breaks out and immediately reverses, the pattern failed. Exit quickly.
  • Expecting the inside bar's color to tell you which way it breaks — it doesn't. Wait for the breakout.
Pattern Stats
Candles:2
Signal:Volatility Pause
Reliability:Medium–High
15
▲▼ High-Momentum Breakout
Outside Bar
Opposite of Inside Bar — expansion instead of contraction

"One side completely overwhelmed the other — the price didn't just test new territory, it exploded through and kept going."

Outside Bar two-candle momentum breakout pattern — second candle completely engulfs first candle's full range showing explosive volatility
Day 2 engulfs Day 1's full range
The Explosive Opposite of an Inside Bar

Where an Inside Bar shows volatility contracting, an Outside Bar shows volatility exploding violently. The second candle's range completely engulfs the first — trading above yesterday's high AND below yesterday's low, before closing decisively in one direction.

This tells a story of a market that trapped traders on one side, then violently reversed to trap them. The second candle tests both the high (trapping sellers with short stops) and the low (trapping buyers with long stops) before accelerating in the ultimate closing direction.

The closing direction is everything. An Outside Bar that closes in the upper 25% of its range is strongly bullish. One that closes in the lower 25% is strongly bearish. A close in the middle (near the prior session's range) signals continued confusion.

Reading the Outside Bar
Bullish Outside BarCloses in the top 25% of its range, above the prior candle's high. Strong buy signal. Buyers won the battle for both extremes and held the high.
Bearish Outside BarCloses in the bottom 25% of its range, below the prior candle's low. Strong sell signal. Sellers won both extremes and held the lows.
?
Middle CloseCloses near the center of the range. This signals continued indecision — neither side truly won despite the volatility explosion. Wait for more clarity.
▲ How to Trade It

Bullish: Enter long as the Outside Bar closes strongly. Stop below the Outside Bar's low.
Bearish: Enter short as the Outside Bar closes weakly. Stop above the Outside Bar's high.
Rule: Only trade Outside Bars with a decisive directional close. Skip ambiguous middle closes entirely.

Common Mistakes
  • Trading an Outside Bar that closes in the middle — no clear winner means no trade.
  • Confusing it with a Bearish/Bullish Engulfing — the Outside Bar uses full range (wicks), Engulfing uses bodies only.
  • Forgetting that Outside Bars often occur on news events — the high volatility can make stops more difficult to manage.
Pattern Stats
Candles:2
Signal:Momentum Breakout
Reliability:High (if decisive close)

3-Candle Patterns

Three-Candle Patterns

Three sessions. Three chapters of a complete story — setup, pause, and confirmation. These are the most highly trusted reversal patterns in technical analysis.

16
▲ Highly Reliable Bullish Reversal
Morning Star

"Darkness, hesitation, then dawn. The stock has bottomed out. The new day is beginning."

Morning Star three-candle bullish reversal pattern — bearish candle, small star, then large bullish confirmation candle at bottom of downtrend
Bear · Star · Bull
The Three-Act Story

The Morning Star is one of the most powerful and reliable reversal patterns in candlestick analysis. Each of its three candles plays a distinct, essential role:

Act 1 — The Bearish Day: A large red candle. Sellers are firmly in control. The downtrend continues as expected. Bears feel confident.

Act 2 — The Star: A tiny candle (often a Doji or near-Doji) that gaps down below the first candle's close. This is the moment the downtrend pauses. Sellers tried to push lower but barely moved the price. Selling momentum has stalled. The "star" is suspended below the prior candle, representing the uncertainty and exhaustion at the bottom.

Act 3 — The Bullish Confirmation: A large green candle that surges powerfully upward, closing deeply into the body of Day 1's red candle — ideally above its midpoint. Buyers have definitively taken control. The reversal is confirmed. The "morning" has arrived after the darkness.

Together, these three candles tell a complete, confirmed story: sellers exhausted, buyers energized, trend reversed.

Anatomy — Every Element Matters
Day 1Large bearish candle. The larger the body, the more significant the subsequent reversal.
Day 2 (The Star)A small-bodied candle (Doji, Spinning Top, or tiny body) that gaps down from Day 1. The gap is important — it separates the star visually and shows sellers initially continued but lost all conviction. Color of the star doesn't matter.
Day 3A large bullish candle. Must close at least halfway into Day 1's body. The deeper into Day 1 it closes, the more powerful the signal. If it closes above Day 1's open — even more bullish.
Volume PatternIdeal: High volume on Day 1, low on Day 2, very high on Day 3. This volume pattern confirms the sequence of selling → pause → buying.
▲ How to Trade It

Entry: Buy on Day 3's close, or on Day 4's open after confirmation.
Stop-Loss: Below the low of Day 2 (the star's low — the bottom of the pattern).
Target: Previous resistance level or Fibonacci retracement. Minimum 2:1 risk/reward.

Common Mistakes
  • Accepting a pattern where Day 3 doesn't penetrate at least 50% into Day 1's body — a shallow close reduces the signal's reliability significantly.
  • Ignoring the gap between Day 1 and Day 2 — no gap means no star, just a sequence of candles.
  • Using this pattern outside of a clear downtrend. The Morning Star only reverses a trend that exists.
  • Forgetting to check volume — low volume on Day 3 is a red flag that the reversal may not have institutional support.
Pattern Stats
Candles:3
Trend:Bottom of Downtrend
Reliability:Very High
Stop:Below Day 2 Low
Doji Star Upgrade

When Day 2 is specifically a Doji (rather than any small candle), the pattern is called a Morning Doji Star — and it's even more reliable. The Doji on Day 2 makes the indecision/exhaustion point even clearer, adding another layer of confirmation to the eventual bullish reversal.

17
▼ Highly Reliable Bearish Reversal
Evening Star

"The rally reaches its peak under a bright evening star — then the night falls. The bull run is over."

Evening Star three-candle bearish reversal pattern — bullish candle, small star, then large bearish confirmation candle at top of uptrend
Bull · Star · Bear
The Three-Act Story

The Evening Star is the bearish mirror image of the Morning Star — equally powerful, equally reliable, equally important to know.

Act 1 — The Bullish Day: A large green candle. Buyers are in full control. The uptrend continues strongly. Bulls feel confident and may be adding to positions.

Act 2 — The Star: A tiny candle that gaps up above Day 1's close. Initially this looks bullish — but the tiny body shows that buying momentum has completely stalled. Buyers tried to push higher but the market barely moved. The "star" sits above the prior candle, shining brightly — but it's an evening star, signaling the approaching darkness.

Act 3 — The Bearish Collapse: A large red candle crashes down, closing deeply into Day 1's bullish body. Sellers have completely seized control. The reversal is confirmed.

The pattern is particularly devastating for bulls caught at the top — they bought during Day 1's rally, watched Day 2 do nothing, and then see Day 3 erase all those gains.

Anatomy
Day 1Large bullish green candle confirming the uptrend.
Day 2 (The Star)Small-bodied candle gapping up. Can be bullish or bearish — what matters is the tiny body. A Doji star makes this an "Evening Doji Star," even more bearish.
Day 3Large bearish candle that gaps down and closes at least halfway into Day 1's body. The deeper the penetration, the stronger the sell signal.
▼ How to Trade It

Entry: Sell/short as Day 3 closes, or on Day 4's open.
Stop-Loss: Above the high of Day 2 (the star) — the highest point of the pattern.
Target: Prior support levels. Minimum 2:1 risk/reward.

Common Mistakes
  • Selling before Day 3 closes — always wait for the full bearish confirmation candle.
  • Accepting a Day 3 that barely penetrates Day 1 — a shallow close significantly reduces reliability.
  • Using it outside a clear uptrend context — context is everything for this pattern.
Pattern Stats
Candles:3
Trend:Top of Uptrend
Reliability:Very High
Stop:Above Day 2 High
18
▲ Highly Reliable Bullish Reversal
Three White Soldiers

"Not a fluke. Not a one-day wonder. Three consecutive sessions of pure buyer dominance — a new bull trend has begun."

Three White Soldiers three-candle bullish reversal pattern — three consecutive large green candles each opening within prior body and closing near high
Three ascending green candles
Why Three Sessions Changes Everything

A single bullish candle could be a fluke. Two could be a brief relief rally. But three consecutive sessions of strong buying, each following the same discipline? That is a trend change — confirmed.

The Three White Soldiers pattern features three consecutive large green candles, each following a specific disciplined pattern: each one opens within the body of the previous candle (not gapping up wildly — a controlled advance) and closes near its daily high (showing buyers are still pushing at the end of each session with no exhaustion).

This combination — opening within the prior body and closing near the high — is crucial. It shows steady, disciplined accumulation rather than a panic-driven short squeeze. Institutions are systematically buying over three consecutive sessions, and the market is responding methodically.

The pattern is most powerful when it appears after a significant downtrend or at a key support level, signaling that the selling pressure has been completely overwhelmed by new buying demand.

Strict Rules — All Three Must Be Met
Three Consecutive Green CandlesAll three must be bullish (green/white). No exceptions — any red candle in the sequence breaks the pattern.
Each Opens Within Prior BodyEach candle opens inside the body (between the open and close) of the previous candle — not above its close. This shows controlled, not frenzied buying.
Each Closes Near Its HighEach candle closes near its session high, with little or no upper wick. Buyers are still pushing at the close — no exhaustion yet.
Each Is Long-BodiedSmall candles don't qualify. Each soldier must have a substantial body showing strong daily price movement in the buyer's favor.
▲ How to Trade It

Buy on Day 4's open (the first session after the pattern completes) or at a slight pullback to Day 3's midpoint. Stop below Day 3's low.
Warning: After three strong sessions, a short-term pullback is common before the rally continues. This is normal — don't panic out of positions.

Warning Signs That Weaken the Pattern
  • Any of the three candles has a large upper wick — shows buyers losing steam by the close.
  • The candles are getting progressively smaller (exhaustion forming).
  • High volume on Day 1-2 but dramatically lower volume on Day 3 — the buying is running out of participants.
  • The pattern forms after an already long uptrend (instead of at a bottom) — this signals continuation fatigue, not fresh reversal.
Pattern Stats
Candles:3
Trend:Bottom of Downtrend
Reliability:Very High
What Three White Soldiers Means Institutionally

When three consecutive sessions of strong buying occur in a disciplined pattern, it typically means large institutional investors (funds, banks, pension funds) are systematically accumulating shares over multiple sessions. They can't buy everything at once without moving the price against themselves, so they spread purchases across days. The Three White Soldiers pattern is often their footprint.

19
▼ Highly Reliable Bearish Reversal
Three Black Crows

"Three days of relentless, disciplined selling. The buyers have been broken. A new bear trend has arrived."

Three Black Crows three-candle bearish reversal pattern — three consecutive large red candles each opening within prior body and closing near low
Three descending red candles
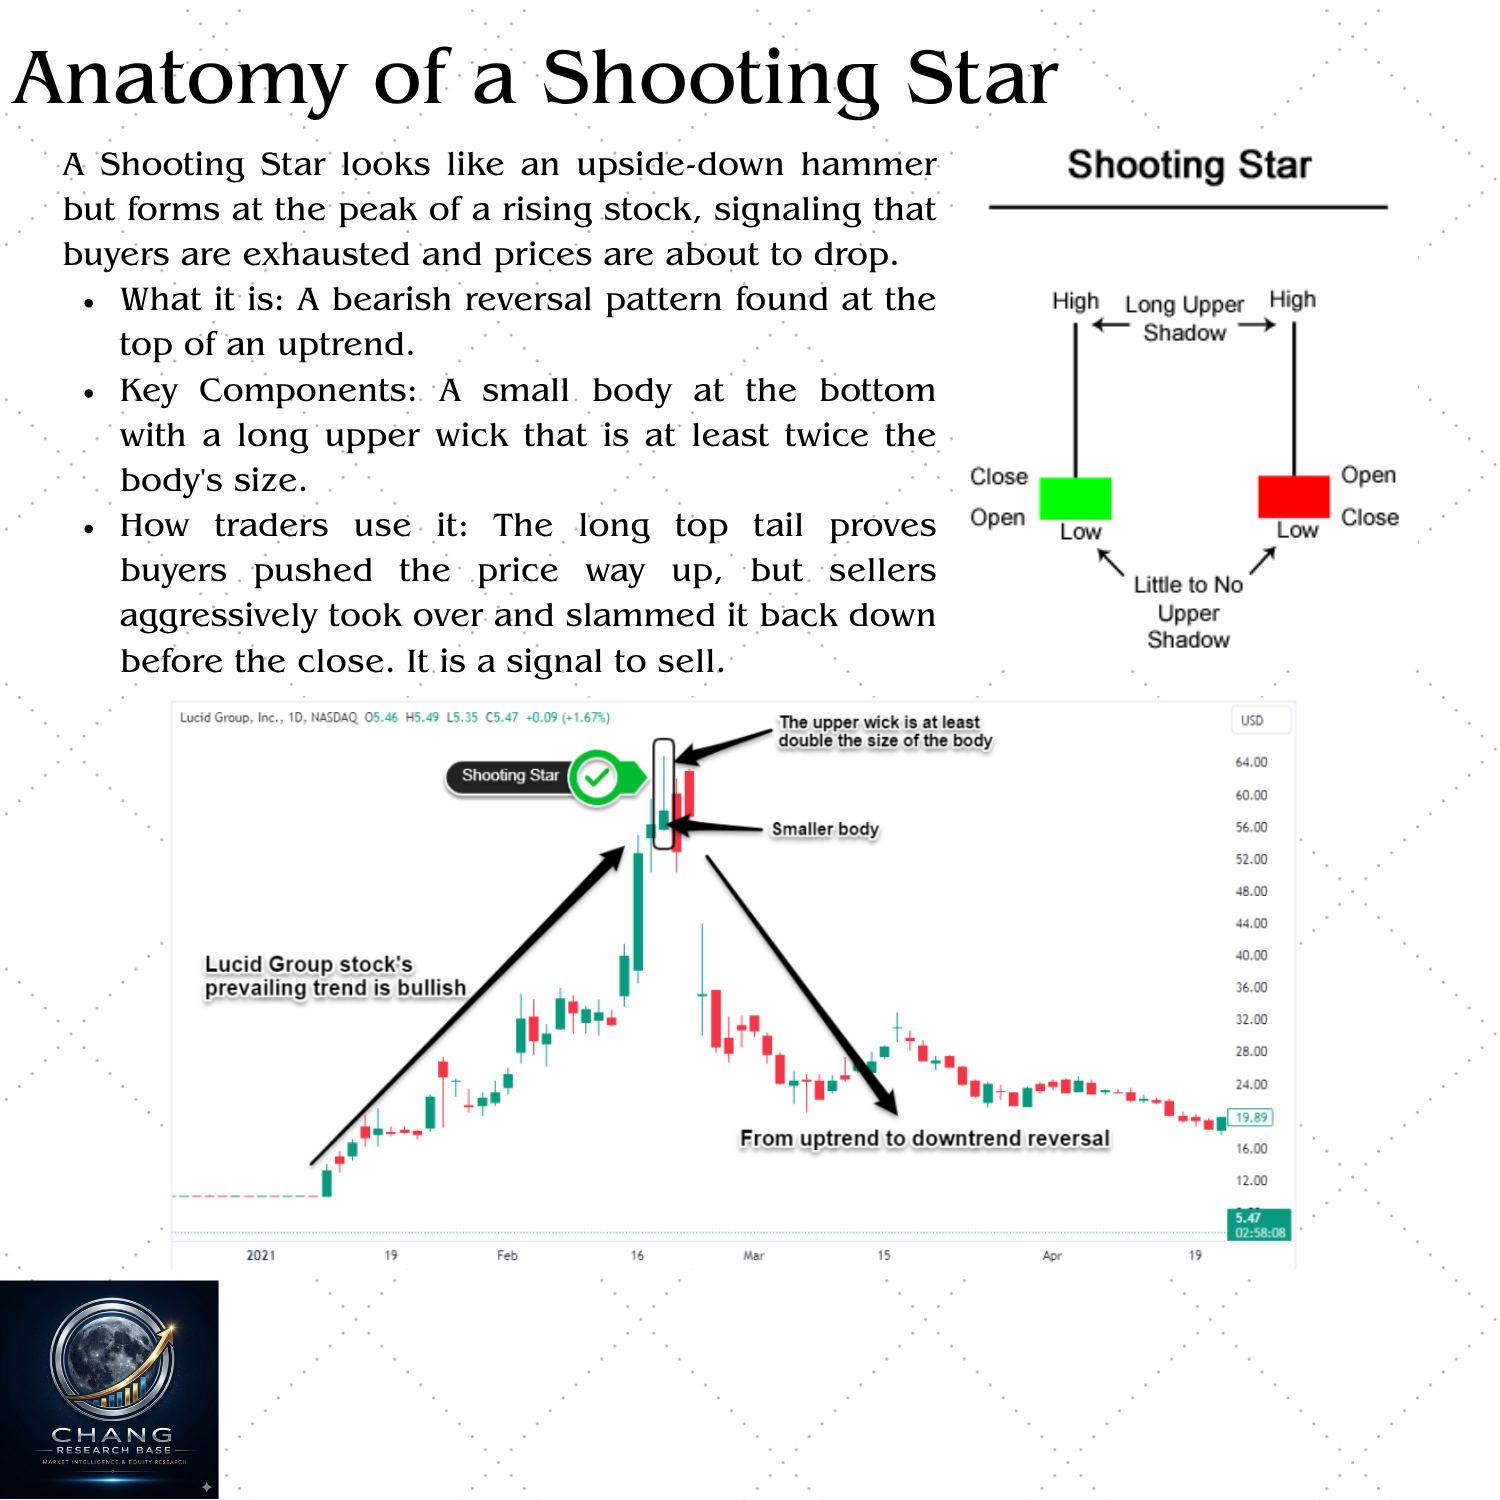
The Dark Mirror of Three White Soldiers

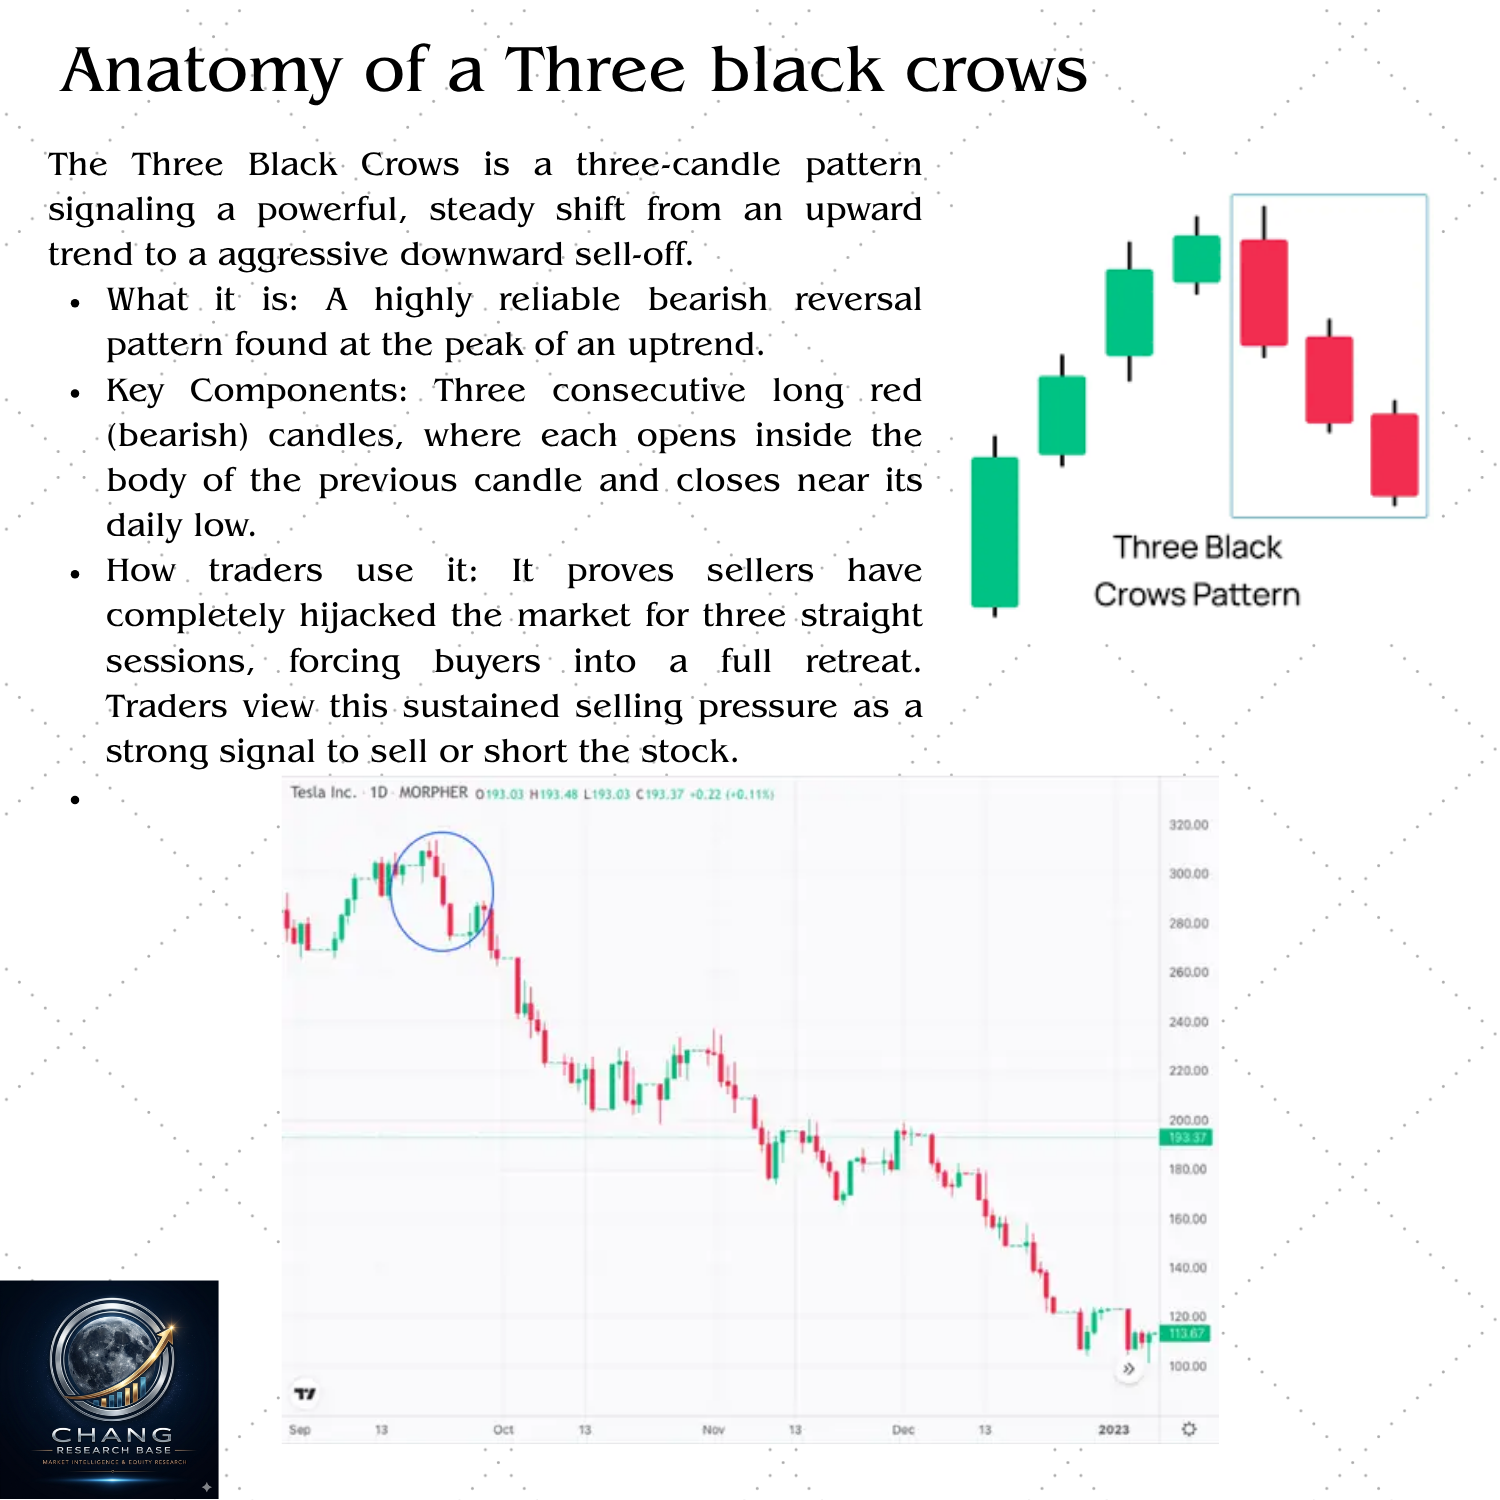
Three Black Crows is the bearish equivalent of Three White Soldiers — and it is equally feared and respected. Three consecutive long red candles, each following strict rules, signal that sellers have decisively taken control of the market for three straight sessions without buyers mounting any meaningful response.

The pattern earns its ominous name because in many cultures, crows circling overhead are seen as harbingers of death — and for bulls, this pattern is exactly that. Three sessions of systematic, disciplined selling pressure.

Unlike a panic-driven crash (which can reverse quickly), Three Black Crows represents orderly, institutional distribution — large holders are systematically unloading positions over multiple sessions. This kind of selling tends to continue for longer and doesn't reverse easily.

The pattern is most significant when it appears at the top of a prolonged uptrend, at key resistance levels, or after a period of euphoric buying.

Strict Rules
Three Consecutive Red CandlesAll three must be bearish. The second and third are more important — they confirm that Day 1 wasn't just a one-off reversal.
Each Opens Within Prior BodyEach candle opens within the body of the prior candle — a controlled, disciplined decline, not a gap-down panic.
Each candle closes near its session low, with little or no lower wick. Sellers are dominating right up to the close — no bounce, no mercy.
All Large-BodiedSmall candles don't qualify. Each crow must have a substantial body representing significant daily selling.
▼ How to Trade It

Entry: Sell/short on Day 4's open. A slight bounce back into Day 3's body (if it occurs) is an even better entry point.
Stop-Loss: Above Day 3's high (or Day 1's high for a wider stop).
Caution: After three large red candles, a dead-cat bounce (brief up-move) is common before selling resumes. Don't get spooked out of the position by a brief bounce.

Warning Signs That Weaken the Pattern
  • Large lower wicks on any of the three candles — shows buyers fighting back at the close, weakening the bearish signal.
  • Progressively smaller candles (sellers losing momentum on Day 2 and 3).
  • Volume dropping significantly by Day 3 — fewer participants = weaker conviction.
  • Pattern forming after a crash that already has stocks at very depressed levels — potential exhaustion of sellers rather than a new wave.
Pattern Stats
Candles:3
Trend:Top of Uptrend
Reliability:Very High
Institutional Distribution Footprint

Just as Three White Soldiers signals institutional accumulation, Three Black Crows often signals institutional distribution — large holders systematically selling positions over multiple days to avoid crashing the price all at once. When you see this pattern after a prolonged bull market, be very cautious about holding long positions.

Master These First

The 7 Universal Rules of Candlestick Trading

Pattern recognition is only half the skill. These rules are what separate profitable traders from those who get destroyed.

01
Trend Context Is Non-Negotiable

A Hammer at a bottom is bullish. A Hammer at the top (Hanging Man) is bearish. The exact same candle has completely opposite meanings based on where it appears. Always identify the trend before identifying the pattern.

02
Wait for the Next Candle

Candlestick patterns signal potential — not certainty. Always wait for the next candle to close in the expected direction before entering a trade. This one habit alone eliminates the majority of false signals that trap beginners.

03
Volume Validates Everything

A pattern with high volume is dramatically more reliable than the same pattern on thin volume. High volume = institutional participation. Without volume backing a pattern, you're trading a shadow. Always check volume before entering.

04
Key Levels Supercharge Patterns

A Pin Bar at a major resistance level is a completely different signal from a Pin Bar in the middle of a chart. Support, resistance, Fibonacci levels, moving averages, and trend lines all amplify pattern signals. The best trades have multiple factors aligning at once.

05
Size the Pattern Relative to Recent Candles

A Bullish Engulfing needs the green candle to be noticeably larger than surrounding candles to matter. Patterns formed by tiny candles in a market full of large candles are unreliable. The size of the pattern relative to recent activity determines its strength.

06
Timeframe Determines Significance

A Morning Star on a weekly chart is far more powerful than one on a 1-minute chart. Higher timeframes carry more weight. Patterns on daily and weekly charts reflect decisions by large institutional traders. Use multiple timeframes — confirm higher timeframes before acting on lower timeframe signals.

07
Risk Management Trumps Pattern Recognition

Even the most reliable pattern fails 30-40% of the time. No pattern wins every trade. Your stop-loss placement and position sizing determine whether you survive the losses to benefit from the wins. Always define your maximum loss before entering any trade. The best traders think about risk first and profit second.

⚠️ Important Disclaimer

Candlestick patterns are tools for probabilistic analysis, not guaranteed predictions. Past pattern performance does not guarantee future results. All trading involves substantial risk, including the possible loss of your entire investment. This guide is for educational purposes only and does not constitute financial advice. Always use stop-losses, practice on paper trading accounts, and consider consulting a qualified financial advisor before trading with real capital.